




Our results, measured

Biomimetic Dentistry.55% Less Drilling.

Across 2023, 2024 and 2025, we drilled 54.8% less per guest than we did in 2019, our last full year of traditional dentistry. Full crowns and root canals fell with it. Every figure on this page comes from our own records, and this page shows exactly how we counted.

55%
less drilling
73%
fewer full crowns
53%
fewer root canals needed

Per 100 active guests. Average of 2023 to 2025, compared with 2019.

Drilled restorations

55% less drilling per guest

How much of your tooth does a dentist need to remove? Every filling, inlay, onlay and crown starts the same way: cutting away tooth structure you will never get back. So the clearest measure of how conservative a practice is comes down to how often it drills.

In 2019 we placed 87.91 drilled restorations for every 100 active guests. Across 2023 to 2025 the average was 39.74. That is 54.8% less drilling per guest.

And it has held. Three years in a row, the rate sat within one point of 40.

0 20 40 60 80 100 COVID Transition Comparison 2019 87.91 2020 69.72 2021 66.62 2022 59.08 2023 39.92 2024 40.07 2025 39.22 2019 baseline Average 39.74 Drilled restorations per 100 active guests
Drilled restorations per 100 active guests, by year. 2020 (COVID) and 2022 (transition year) are shown but are not part of the comparison.
Drilled restorations per 100 active guests
YearPer 100 active guests
201987.91 baseline
202069.72 COVID, excluded
202166.62 biomimetic implementation begins
202259.08 transition year, excluded
202339.92
202440.07
202539.22
2023 to 2025 average39.74 54.8% below 2019

What counts as drilled

Every completed filling, inlay, onlay and crown, counted once per procedure no matter how many surfaces it covers. Crownlays count here too, because a crownlay is still drilled. Buildups, temporary crowns and veneers are not counted. Neither are root canals, because a tooth that has one is counted once, through the restoration that follows.

0

One number that has never moved

Zero. We have never placed a single amalgam (silver mercury) filling, in any year, since the practice opened.

Full coverage crowns

73% fewer full crowns

A full crown means grinding a tooth down on every side, all the way to the gumline, and capping what is left. It takes more of your natural tooth than any other restoration.

In 2019 we placed 7.85 full crowns for every 100 active guests. Across 2023 to 2025 the average was 2.13. That is 72.8% fewer.

Most of those teeth did not get less care. They got a crownlay.

0 2 4 6 8 10 COVID Transition Comparison 2019 7.85 2020 not calculated 2021 2.83 2022 2.43 2023 2.37 2024 2.11 2025 1.92 2019 baseline Average 2.13 Full coverage crowns per 100 active guests
Full coverage crowns per 100 active guests, by year. 2020 is not calculated for this series. 2022 is a transition year and is not part of the comparison.
Full coverage crowns per 100 active guests
YearPer 100 active guests
20197.85 baseline
20212.83 biomimetic implementation begins
20222.43 transition year, excluded
20232.37
20242.11
20251.92
2023 to 2025 average2.13 72.8% below 2019

What a crownlay is

A crownlay covers and protects every cusp of a damaged tooth, but it stops above the gumline instead of wrapping all the way down. More of your natural tooth stays. It holds up because of the bonding protocols Dr. Pinto learned in her biomimetic training, which is why she did not place crownlays before 2021. Since 2021 we have placed 254 of them. In 2019, each of those teeth would have received a full crown.

How we counted crowns

Insurance has no code for a crownlay, so every one is billed as a crown. That means billing records overstate full crowns. Dr. Pinto reviewed the X-rays of all 540 crowns placed since 2021 and marked each one as a full crown or a crownlay. Only full crowns are counted here, and each tooth counts once: replacing the same crown later does not add a second.

Crowns before 2021 needed no review. She was not placing crownlays yet, and a blind check of 2018 and 2019 crowns, mixed unlabeled into the audit, confirmed it.

Root canal diagnoses

53% fewer root canals needed

In 2019 we diagnosed 7.25 root canals for every 100 active guests. Across 2023 to 2025 the average was 3.38. That is 53.4% fewer.

0 2 4 6 8 10 COVID Transition Comparison 2019 7.25 2020 5.53 2021 7.93 2022 2.98 2023 3.33 2024 3.53 2025 3.28 2019 baseline Average 3.38 Post-COVID backlog Root canal diagnoses per 100 active guests
Root canal diagnoses per 100 active guests, by year. 2020 (COVID) and 2022 (transition year) are shown but are not part of the comparison.
Root canal diagnoses per 100 active guests
YearPer 100 active guests
20197.25 baseline
20205.53 COVID, excluded
20217.93 post-COVID backlog
20222.98 transition year, excluded
20233.33
20243.53
20253.28
2023 to 2025 average3.38 53.4% below 2019
“

They showed me how close I was to needing a root canal. I avoided it.

★★★★★Calvin G · Google

Why we count diagnoses, not procedures

Most root canals we find are performed by a specialist we refer to. If we counted only the ones done in our office, the number would fall just because of where the work happens. So we count every root canal we planned, performed or referred out.

There is one complication. When a referred root canal is finished, our software relabels it as work done by another provider, the same label used for root canals guests already had when they first arrived. No setting separates the two. So we reviewed 1,502 records by hand to separate new diagnoses from old work.

Why 2021 went up

2021 is the one year in any of these series that moved the wrong way. Guests came back after a year of postponed care, with problems that had grown untreated during the pandemic. We show it rather than smooth it away.

What changed, and when

The timeline behind the numbers

  1. 2019

    Our baseline. The last full year of traditional dentistry: full crowns only, and no biomimetic training yet.

  2. 2020

    COVID. The practice was closed or restricted for part of the year, so every rate fell. Not a treatment result, and left out of every comparison.

  3. 2021

    Dr. Pinto begins practicing biomimetic dentistry. Root canals rise this year as guests return with problems postponed through the pandemic.

  4. April 2022

    Dr. Pinto completes Dr. David Alleman’s biomimetic mastership. 2022 is a transition year, half of it spent still training, so it is shown but not compared.

  5. 2023

    Our in-house endodontist leaves. There was no longer enough root canal work to fill her schedule.

  6. 2023 to 2025

    The comparison period: the first three years practiced fully trained from January 1.

  7. 2025

    Drill-free treatment arrives: 146 teeth treated without a drill, up from 5 the year before.

The comparison starts in 2023, not 2022, because 2023 is the first year that began with the training complete.

Why the numbers move together

A tooth only has so much to give.

Two things help explain why drilling, crowns and root canals fall together.

The first is what a crown costs you.

Preparing a tooth for a full coverage crown means drilling the whole tooth down, and that drilling often comes close to the nerve. The nerve can react to that trauma with lasting pain and sensitivity, and at that point a root canal becomes the fix. That root canal isn’t treating an infection that reached the nerve on its own. They’re treating trauma the drilling caused. Do fewer crowns, drill less, and a lot of root canals simply never happen.

The second is what’s left over.

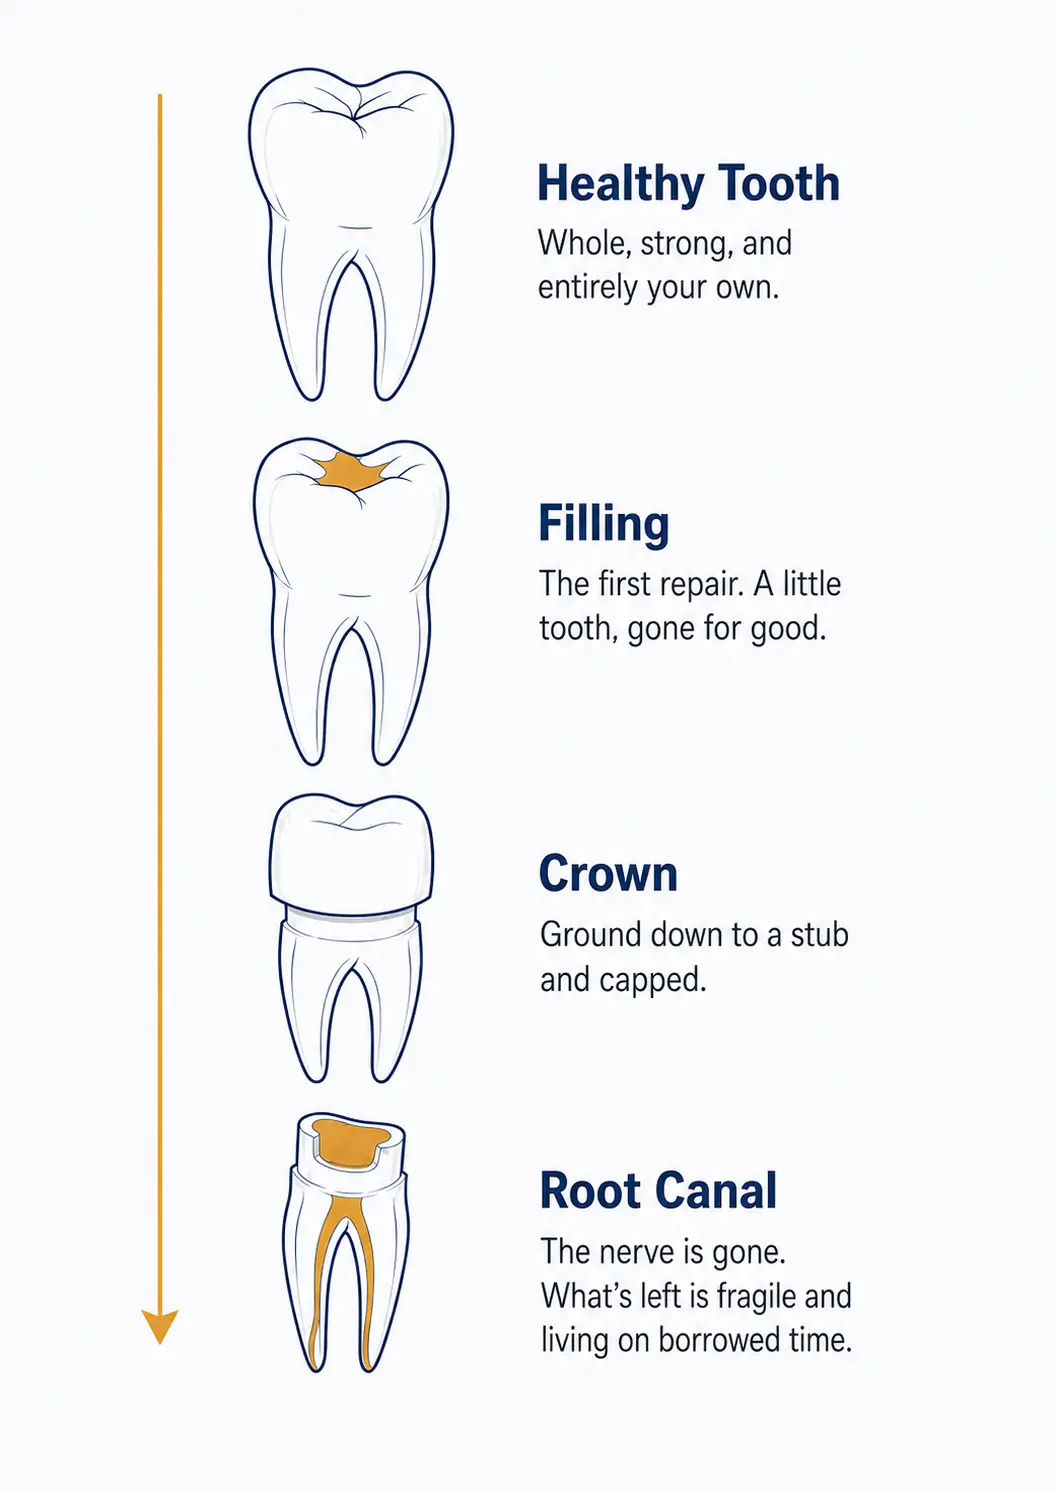
A biomimetic restoration removes only the damage, so there’s still enough healthy tooth left that if decay shows up again years later, we can usually restore it again. Standard dentistry takes more each time. When a large filling fails, the next step is often a crown, and once a tooth is crowned the options narrow from there. The cycle runs in one direction, and it runs faster the more structure you take.

Illustration of the standard dental cycle: the same tooth shown in four stages, healthy, then with a filling, then ground down for a crown, then hollowed by a root canal, with each stage leaving less natural tooth than the one before.
Each stage leaves less than the one before. The point of the work we do is to keep a tooth from moving down this line.

What comes next

154 teeth. No drill at all.

What if the best filling is the one you never need?

Through the end of 2025, we treated 154 teeth without drilling at all, using treatments that seal early decay or help the tooth rebuild enamel instead of cutting the damage out. Before 2025 this was close to zero: 3 teeth in 2022 and 5 in 2024. In 2025 it was 146.

These teeth are not part of the drilling figure above. We track them separately, because this is a new kind of care rather than more of the same, and it is the one number on this page we expect to keep growing.

How we counted

The same rules, every year.

Our own records

Every figure comes from our practice management system. Each procedure was recorded as part of running the practice, not gathered to make a point.

Who counts as active

The industry standard: anyone with a completed visit in the previous 18 months, measured at the end of every month. The yearly figure is the average of the twelve monthly counts, and every guest in it actually sat in a chair.

Per guest, not total

Every figure is a rate per 100 active guests, so a busier or quieter year cannot move it on its own.

Complete years only

We publish full calendar years only and update once a year, after the year closes. 2019 is the fixed baseline. The comparison period grows, the baseline never moves, and years that look worse stay in.

Every dentist, not one

Every figure includes every dentist who has practiced here, all trained by Dr. Pinto in the same approach.

How each figure was checked

Drilling was reproduced independently by rerunning saved database queries. Crowns were audited against X-rays by Dr. Pinto. Root canals combine a hand audit of 1,502 records with a documented rule, and an earlier independent analysis reached a similar result.

Our guest count has changed

Our active guest count has declined since 2022. Care at this level asks more upfront, and not every guest chooses that trade. A smaller guest count makes every rate on this page look worse, not better.

We have also become known for saving teeth other practices would treat more aggressively, so more guests now arrive with damage already advanced. That pushes these rates up over time, not down.

What this data can and cannot tell you

It shows that these declines followed our move to biomimetic dentistry. It does not prove biomimetics was the only reason: materials, the guests who choose us and clinical judgment changed over the same years. This is our own practice data, not a controlled study.

Rounding. We display 55%, 73% and 53%. The precise figures are 54.8%, 72.8% and 53.4%.

Correction, September 2026. This page previously reported 86.5% fewer root canals and 90% fewer crowns. Those figures were wrong. Our earlier count of active guests was too low in the practice’s first years, which made early rates look higher and the decline look larger than it was. We rebuilt the count, restated every figure on this page, and retired the old ones everywhere they appeared.
Dr. Yenile Pinto, DDS, biomimetic dentist at Deering Dental in Palmetto Bay, FL
Dr. Yenile Pinto, DDS
Founder & biomimetic dentist · Deering Dental, Palmetto Bay

Dr. Pinto personally audited the crown records behind this page and reviewed the analysis. She trained in biomimetic dentistry under Dr. David Alleman and has led the practice since 2015.

Dr. Pinto is a regular expert source for national press, quoted in CNN, Forbes, GQ, CNET, Tom’s Guide, theSkimm and Romper, among others.
Forbes GQ CNET Romper
See all press coverage

What the numbers looked like from inside

Root canals fell so far that our endodontist left.

Deering Dental did not start with a root canal specialist. As the practice grew, we were diagnosing root canals often enough to bring an endodontist in-house, a specialist who does nothing but root canals, so guests would not have to be sent elsewhere.

Then the work started to dry up. Her schedule went from two days a week to four days a month, then two days a month. When we could not fill even half of that, she told us she was leaving. She had been holding on, hoping the work would come back. It did not. She left in 2023.

We still work with an endodontist when a tooth genuinely needs one. We just do not have enough of that work to keep one on staff.

That is what 53% fewer root canals looks like from inside a practice.

Questions worth asking

Where do these numbers come from?

From our own practice management system, not a survey or an estimate. Every procedure on this page was recorded as part of running the practice. We measure each one per 100 active guests and compare the average of 2023, 2024 and 2025 with 2019, our last full year of traditional dentistry. Drilling fell 54.8%, full crowns 72.8% and root canal diagnoses 53.4%.

Why compare against 2019?

Because it was the last complete year before anything changed. 2020 was disrupted by COVID. Dr. Pinto began practicing biomimetic dentistry in 2021 and completed Dr. David Alleman’s mastership in April 2022, so 2022 was a transition year. 2023 is the first year that began with the training complete, so the comparison starts there. We use a single baseline year on purpose: averaging several earlier years would let us choose whichever mix looked best.

Do you still do crowns and root canals?

Yes. Some teeth need them, and if yours does, you will hear it from us. The goal was never zero. It is to do them only when there is genuinely no better option. Root canals are performed by an endodontist we trust, and we will tell you honestly whether yours can be avoided first.

What is a crownlay, and why isn’t it counted as a crown?

A crownlay covers and protects every cusp of a damaged tooth but stops above the gumline, so more of your natural tooth stays. It is not a full crown, so it is not counted as one. Insurance has no code for a crownlay and it is billed as a crown, which is why Dr. Pinto reviewed the X-rays of all 540 crowns placed since 2021 to separate the two. We have placed 254 crownlays since 2021.

Why do you count root canal diagnoses instead of root canals performed?

Because most root canals we find are performed by a specialist we refer to. Counting only the ones done in our office would show a drop that has nothing to do with how often teeth need one. So we count every root canal we planned, performed or referred out, and we reviewed 1,502 records by hand to separate new diagnoses from root canals guests already had when they arrived.

Why did root canals rise in 2021?

2021 is the only year that moved the wrong way: 7.93 root canals per 100 active guests, above the 2019 baseline of 7.25. Guests came back after a year of postponed care, with problems that had grown untreated during the pandemic. From 2022 onward the rate has stayed below 3.6.

What happened to the 86.5% and 90% figures?

They were wrong, and we have retired them. Our earlier count of active guests was too low in the practice’s first years, which made early rates look higher and the decline look larger than it was. We rebuilt the count from 39,692 completed appointments, restated every figure on this page in September 2026, and changed the comparison to complete years measured against 2019. The figures on this page replace 86.5% fewer root canals and 90% fewer crowns everywhere they appeared.

How often are these figures updated?

Once a year, after each calendar year closes. We never publish a partial year. 2019 stays fixed as the baseline, and years that look worse stay in the table. If a figure ever moves more than five points in a single year, we investigate before publishing, because real changes in how we practice show up gradually.

Compared to standard dentistry, what happens when a biomimetic restoration fails?

Usually another restoration, where standard dentistry would often need a crown. Preserving as much natural tooth as possible is the whole point of our approach, and it protects you twice. Restorations sealed and bonded this way have shown fewer complications and higher survival rates in a 2025 systematic review and meta-analysis, and if a tooth does need attention again, there’s typically enough of it left to repair rather than cap. You don’t move a step closer to a crown every time you sit in the chair.
More on how we restore teeth

Alghauli MA, Alqutaibi AY, Borzangy S. Clinical benefits of immediate dentin sealing: a systematic review and meta-analysis. J Prosthet Dent. 2025;134(4):996–1004.

Told you need a root canal or a crown?

It may not be your only option. A consultation is where we find out what your tooth actually needs, starting with the most conservative answer.

What Our Guests Say

Less dentistry.  Better health.

Deering Dental - 16709 Old Cutler Rd. Palmetto Bay, FL 33157

OFFICE HOURS

Monday 9:00 AM - 5:00 PM

Tuesday 9:00 am - 5:00 pm

Wednesday 10:00 am - 6:00 pm

Thursday 9:00 am - 5:00 pm

Friday Limited Availability for Select Appointments

Deering Dental Miami
Skip to content